
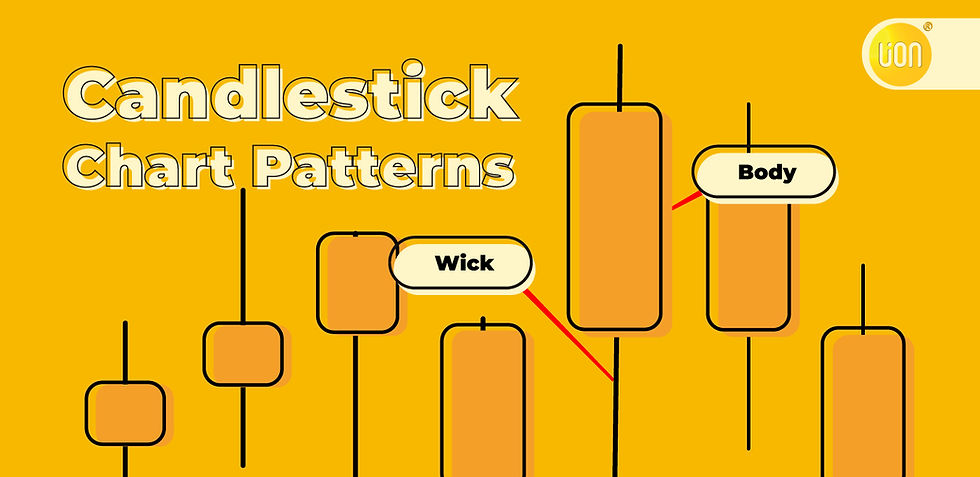
What is a Candlestick chart?
Candlestick charts are one of the most popular components of technical analysis, enabling traders to interpret price information quickly and from just a glance. Here are some other resources about charts.
In this article, we will focus on candlestick chart patterns. It could help you to enhance your knowledge of candlesticks and technical analysis. There are numerous candlestick patterns that can signal potential market opportunities. Some of these patterns offer insight into the balance between buying and selling pressures, while others highlight continuation patterns or market indecision. Hence, before you start trading, it is critical that you understand the fundamentals of candlestick patterns and how they might influence your decision-making process.
Bullish Candlestick Patterns
Bullish patterns may appear after a market downtrend and indicate a potential reversal in the direction of price movement. Traders can use them as a guide to consider opening a long position to profit from any upward trend.
1. Hammer
A hammer is a bullish reversal pattern that forms after a price decline, it is characterized by a single candlestick with a short body located at the top of the price range and a long lower wick that extends below the body.
The hammer pattern typically shows the price being pushed lower during the trading session, but buyers have managed to push it back up, closing near the high of the session. This reversal pattern indicates a potential shift from a downtrend to an uptrend.

2. Inverse Hammer
The inverse hammer typically appears at the end of a downtrend and suggests a potential upward reversal in the price. An inverse hammer has a short body and a long upper wick. This indicates that the price is pushed to the higher from the low point of the trading period, showing potential buying pressure.

3. Bullish Engulfing
A bullish engulfing pattern is a significant candlestick pattern in technical analysis that typically indicates a potential reversal of a downtrend. This pattern occurs during a downtrend when a short bearish (downward) candlestick is followed by a longer bullish (upward) candlestick which completely engulfs the previous one. It suggests that buying pressure has become dominant. Traders often view this pattern as a signal to consider holding a long position.
Key characteristics of a bullish engulfing pattern:
- The first candlestick is bearish, indicating selling pressure.
- The second candlestick (bullish) closes above the open of the first candlestick.
- The second candlestick’s body completely engulfs the entire body of the first candlestick.

4. Piercing Line
Piercing line is also one of the reversal patterns that occurs during a downtrend in a price chart. It consists of two candlesticks in which the first candlestick is bearish, whereas the second candlestick is bullish. The second candlestick’s open price is below the low of the first candlestick and close price is above the midpoint of the first candlestick’s body. Hence, the second candlestick signifies a strong bullish reversal.
It indicates a strong buying pressure, as the price is pushed up to or above the mid-price of the previous day.

Bearish Candlestick Patterns
Bearish patterns usually appear after a market uptrend and indicate a point of resistance. When there is heavy pessimism about the market price, traders may typically close their long positions, and open a short position to take advantage of the falling price.
1. Hanging Man
The hanging man is the bearish version of a hammer, it has the same shape but appears during an uptrend and may signal a potential reversal in the price direction. It is characterized by a short body with a long lower wick and little to no upper wick.
The pattern indicates that there was a significant sell-off during that day. It suggests that the buyers initially pushed the price higher but were unable to maintain control, leading a potential shift towards bearish sentiment.

2. Shooting Star
The shooting star has the same shape as the inverse hammer. It typically occurs at the end of an uptrend. It is characterized by a short body near the lower end of the price, a long upper wick, and little or no lower wick.
The pattern signals a potential reversal of the current uptrend, as it indicates that sellers have entered the market and pushed the prices lower after an attempt to move higher. Hence, traders often interpret the shooting star as a sign of weakness in the current trend and a potential signal to consider short positions.

3. Bearish Engulfing
A bearish engulfing pattern is a candlestick reversal pattern that forms at the end of an uptrend. It consists of two candlesticks, the first is a short bullish (upward) candlestick, and the second is a longer bearish (downward) candlestick that completely engulfs the first candlestick.
It indicates a potential trend reversal from bullish to bearish sentiment in the market. It occurs when selling pressure overwhelms buyer pressure, leading to a strong downward move in prices.

4. Evening Star
Evening star typically signals a potential reversal uptrend. This pattern is considered as a powerful indicator of a potential trend change and is often used by traders to make informed selling decisions.

The evening star pattern consists of three candlesticks:
First candlestick
The pattern starts with a long bullish candle, indicating that the market is in an established uptrend. This candlestick demonstrates strong buying pressure, with prices closing significantly higher than the open.
Second candlestick
It is a short-bodied candle, often referred to as a ‘doji’ or a ‘spinning top’. This candle reflects indecision and a potential weakening of the previous bullish momentum. It opens and closes near the same price level, forming a small or non-existent body
Third candlestick
It is a bearish candle that closes well below the midpoint of the first bullish candle. It signifies a shift in market sentiment from bullish to bearish.
Continuation Candlestick Patterns
Doji
A doji is a candlestick pattern that forms when the market’s opening and closing prices are almost at the same point, resulting in a very small or nearly non-existent body. The doji pattern is a neutral signal as it represents market indecision and uncertainty between buyers and sellers during the specific time frame it covers.
Traders often interpret a doji as a potential reversal or continuation signal, depending on its location within a price trend.

Spinning Top
Both spinning top and doji candlesticks indicate market indecision, but they have slightly different visual characteristics. Spinning tops have a short body, which indicates that there is little difference between the opening and closing price. They have long upper and lower wicks that represent the high and low prices reached during the trading period.
Depending on the context, a spinning top can have different implications. In an uptrend, a spinning top may signal potential weakness and a reversal of the trend. In a downtrend, it could indicate potential strength and a reversal. In a sideways or ranging market, it may suggest that the consolidation is likely to continue.

The most effective way to enhance your understanding is by actively engaging in trading activities, using the signals provided by these patterns to guide entry and exit. You can develop your skills in a risk-free environment by opening a demo account on our Lion Brokers’ platform. And, if you feel ready to start trading with real funds, you can open a live account today.
When analysing any candlestick pattern, it is important to keep in mind that although they are effective in predicting trends, they should be used alongside other forms of technical analysis to confirm the overall trend.